|
What's new in this version: - Added Monolithic Power Systems MP2884A and MP2888A voltage controllers support
- Added core, memory, auxiliary PEXVDD and auxiliary 1V8 voltage control for custom design MSI RTX 2080Ti Lightning series graphics cards with MP2888A + MP2884A +uP1816 voltage regulators
- Added VRM and VRM2 temperature monitoring for custom design MSI RTX 2080Ti Lightning series graphics cards
- Added fan control support for AMD Adrenalin 2019 drivers family. Please take a note that AMD Adrenalin 2019 drivers adjust fan speed in PWM duty cycle mode but fan speed monitoring is provided in RPM only, which means that you cannot read back exact programmed fan speed in percents. Due to this limitation, MSI Afterburner is reporting fan speed as percent of maximum RPM instead of real fan duty cycle when default AMD auto fan control is in use. So monitored fan speed can slightly mismatch programmed fan speed curve if you're using default AMD automatic fan control.
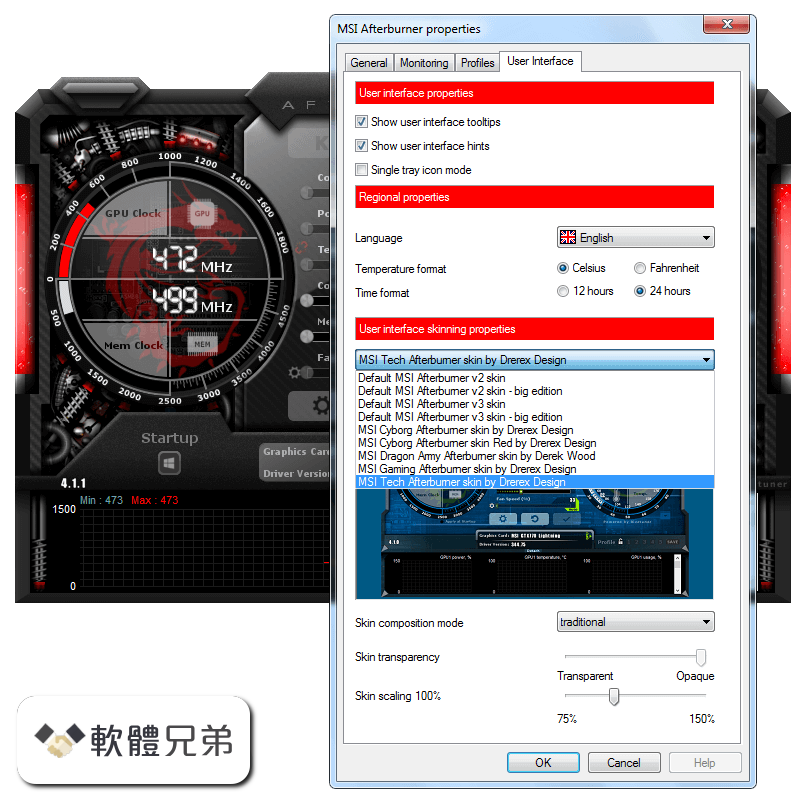
- Added new MSI Gaming Z skin by Drerex Design
- Added framerate limiter compatibility settings group to “On-Screen Display” tab to the application properties. The settings include programmable hotkeys for globally disabling, enabling or toggling framerate limiting techniques of RivaTuner Statistics Server. The settings are intended to provide a way to dynamically enable or disable scanline sync technology based framarate limiting without altering application profiles, however you may use it to toggle traditional framerate limter as well
- Now CPU topology info (i.e. each logical CPU mapping to physical CPU package and core) is displayed in system info window
- Fixed kernel mode hardware access interface fix for AMD Vega GPUs. HBM temperature, GPU power and GPU voltage are no longer returning bogus values when kernel mode hardware access interface is enabled on AMD Vega series graphics cards
- Fixed low-level GPU usage monitoring for AMD Polaris GPU family. Software SMC registers offset is no longer hardcoded, offset detection algorithm is more future proof now. Please take a note that it will not fix zero GPU load issue when "Enable unified GPU usage monitoring" option is enabled. This option implementation is based on low-level DirectX performance counters, which require OS and display driver WDDM versions to match. Current AMD drivers are WDDM 2.5 so this performance counter is only working when you're under WDDM 2.5 OS (Windows October Update). If you're under older OS version, this performance counter won't work unless you downgrade to WDDM 2.4 driver (18.9.3 or older)
- Hardcoded voltage/frequency curve clock multiplier implementation has been replaced with heuristic multiplier detection in order to provide unified voltage/frequency curve control implementation for NVIDIA Pascal and newer NVIDIA GPU architectures
- Improved realtime voltage/frequency curve editor GUI scaling. Now GUI is scaled property when adjusting skin scaling with open voltage/frequency curve editor window
- Improved report window, fan curve editor window, monitoring window and voltage/frequency curve editor scaling for scaling ratios greater than 100%
- Now mandatory MSI Afterburner installation option is greyed out and cannot be unchecked during installation
- Now 64-bit Visual C++ 2008 ru
- Ntimes are also installed by MSI Afterburner installer. 64-bit runtimes are required for proper functionality of bundled MSI Overclocking Scanner application
- Multilanguage user interface library is DPI aware now. Main window skinned interface is no longer being scaled by OS and no longer looks blurred by default when greater than 100% DPI is selected. Now main skinned window interface can be manually zoomed with skin scaling slider in “User interface” tab, and the properties are automatically scaled by OS according to selected DPI
- Added new skin scaling mode for power users. New mode provides better scaling performance at the expense of some scaling image quality loss
- Skin scaling implementation is now asynchronous, so increasing skin scaling ratio doesn’t increase GUI update time and doesn’t decrease GUI response time
- Skin scaling slider range has been extended from 75%-150% to 75%-200%
- RivaTuner Statistics Server has been upgraded to v7.2.1
Added NVIDIA Turing GPU architecture support:
- Added voltage control for reference design NVIDIA GeForce RTX 20x0 series graphics cards
- Advanced GPU Boost control for NVIDIA GeForce RTX 20x0 series graphics cards. Extended voltage/frequency curve editor on GeForce RTX 20x0 family graphics cards allows you to tune additional piecewise power/frequency floor and temperature/frequency floor curves. Control points on those new curves allow you to control GPU Boost power and thermal throttling algorithms more precisely than traditional power limit and thermal limit sliders
- Hardware abstraction layer has been revamped to provide support for multiple independent fans per GPU due to introducing dual fan design on reference design NVIDIA GeForce RTX 20x0 series graphics cards and due to introducing native dual fan control in NVAPI. Both fans of NVIDIA GeForce RTX 20x0 can be monitored independently in hardware monitoring module now and can be controlled synchronically in manual mode
- Added NVIDIA Scanner technology support
Added AMD Vega 20 GPU architecture support:
- Added Overdrive 8 technology support for AMD RADEON VII series graphics cards
- Added extended thermal monitoring for RADEON VII series graphics cards. Extended thermal monitoring includes dualchannel GPU temperature monitoring (edge and junction temperatures), memory temperature monitoring and quadchannel VRM temperature monitoring (core, SOC and two memory VRM temperatures)
- GPU usage monitoring filtering algorithms are reenabled for AMD ADL based GPU usage monitoring implementation to minimize fluctuations in monitored GPU usage on AMD RADEON VII series graphics cards. Please take a note that filtering algorithms make GPU usage graph more inert and smooth, so you may disable them via configuration file if necessary
Improved hardware monitoring module:
- Added thermal offset for CPU temperature monitoring on AMD Ryzen 7 2700X processors
- Similar CPU temperatures are now cloned for all cores on AMD CPUs to provide more convenient and unified On-Screen Display layout between Intel and AMD CPUs
- “Pagefile usage” graph in hardware monitoring module has been renamed to “Commit charge”
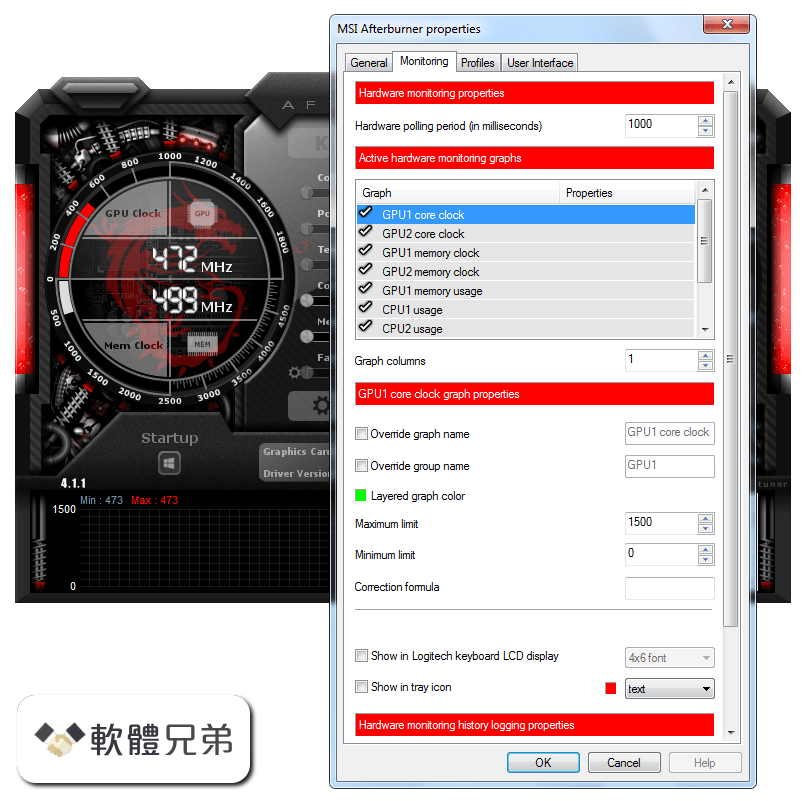
- Added group operation notifier to the caption of active hardware monitoring graphs list in “Monitoring” tab in the application properties. The notifier is informing you that you can apply a setting to all or to multiple selected hardware monitoring graphs when you hold group operation key (i.e. or ) and hover mouse cursor over the setting that can be applied to multiple hardware monitoring graphs at once (e.g. “Show in On-Screen Display”)
- Added “Select by group” and “Select by type” commands to context menu of active hardware monitoring graphs list in “Monitoring” tab in the application properties. New commands allow selecting the graphs of exactly the same type (e.g. CPU1-CPU8 usage graphs on eight core CPU) or the graphs with the same OSD/LCD group name (for example, GPU clock, GPU power, GPU usage and the rest graphs with “GPU” group name). Such commands allow you to show similar items (e.g. all CPU usages) in On-Screen Display with a single click or rename a group for all child graphs in the single pass
- Multi group edit mode is automatically selected now for group name edit field when you enable "Override group name" option while holding key. You may still manually toggle this mode with + hotkey anytime when editing the group name
- On-Screen Display item type (i.e. text, graph or combination of both) is now displayed in “Properties” column of active hardware monitoring graphs list in “Monitoring” tab in the application properties
- Added programmable hotkey for clearing monitoring history
- Added “Apply” button to application properties window. Now you may iteratively customize monitoring module without closing the properties to see the result on each step. Please take a note that some properties (e.g. application language) cannot be applied until you completely close properties window by design of application
- Application properties dialog window is now displayed with topmost style when the properties are activated from detached monitoring window and “Always on top” mode is enabled for it
- Now “Mark minimum” and “Mark maximum” commands are available in the context menu of monitoring window even when a fragment of history is not selected. In this case the commands result in setting tracking marker in a global
- Extremum position. You may still use key and mouse cursor to select a fragment of history then use the context menu to set tracker marker in local extremum position
- Now you may press key in monitoring window to capture print friendly screenshot of hardware monitoring history graphs. The screenshot includes MSI Afterburner watermark by default, you may customize it by replacing overlay.png file located in .Graphics folder. This feature can be useful for hardware reviewers
- Now you may hold key then click unwanted graphs in hardware monitoring history viewer mode to hide them. This feature can be useful before capturing print friendly screenshot, if you want to exclude unnecessary graphs from it
Improved On-Screen Display layout editor:
- System reserved variable slots 250-255 are now displayed as system variables in the layout editor
- Added embedded graphs support. Embedded graphs can be displayed directly in the text in a separate column, it can be convenient for displaying per-core CPU usages
- Added embedded graph width adjustment variable to the “Graph” property node
- Added new “Graph placement” property node. You can use it to place each graph on top of text, on bottom or make it embedded in in text column
- Added new variables to “Separators” property node. Now you may define independent separators for the graphs located on top of text part, for the text part and for the graphs located on bottom of text part.
- Slightly altered interpretation of prolog and epilog separators. Please take a note that prolog separator is no longer automatically appended with new line symbol, so you must specify it manually when necessary and epilog separator is now displayed below the bottom group of graphs
- The list of hardware monitoring items in “Add item(s)” dialog window is alphabetically sorted now
- Added macroses for embedding any data from monitoring module into OSD text (e.g. prolog). You may use macroses to display anything available in the monitoring module, e.g. %CPU temperature%
- Improved On-Screen Display hypertext formatting performance due to more optimal macro replace strategy
- Revamped “modern web” layout. New layout is demonstrating new text formatting features including big custom framerate counter, custom embedded background and On-Screed Display header, custom benchmark and system time indicators and embedded CPU and GPU usage graphs
- On-Screen Display layouts are saved in monitoring profiles now
- Improved HwInfo plugin:
- Added UPS load, power, input voltage and charge level data sources to default plugin configuration
Improved voltage/frequency editor:
Voltage/frequency editor window is now available on AMD GPUs. On AMD platform it allows you to edit core frequencies and voltages independently per each P-State:
- Similar to NVIDIA GPUs, you may either adjust each point frequency or voltage independently with both mouse and keyboard ( / or + / + keys), hold key and drag single point to apply similar frequency or voltage offset to all P-states or hold key and drag single point to add the same offset to each P-State frequency or voltage offset
- You may press / keys to switch between frequency or voltage keyboard input focus for selected P-State
- Read only P-States are currently not tracked, which means that you can try to adjust the frequency and voltage for locked states but changes will be ignored when applying the curve
- P-States locking functionality is not implemented yet
- Now you may press / + keys when a point is selected to switch to the next / previous point. This feature can be useful if you’re fine-tuning the offsets from keyboard
- Now you may press key when a point is selected to type in desired frequency or voltage offset for it o Now you may press + keys when a point is selected to type in absolute desired frequency or voltage explicitly and let the editor to calculate the offset automatically
Added undo/redo support:
- Now voltage/frequency curve editor is saving up to 1024 last states of the curve during editing and allows you to undo/redo changes with + or + / ++ keys
- Undo history is discarded when you apply the curve
- Number of recorded undo/redo steps is displayed in square brackets in the editor window caption
- Slightly increased default voltage range for voltage/frequency curve. Now you may lock voltage to lower values if you’re using voltage/frequency editor to downvolt and reduce power consumption on your NVIDIA GPU. Power users may customize the range further, the voltage and frequency limits are fully adjustable via the configuration file
- Now you may press key in the editor window to reread the curve from hardware. This feature can be useful when adjusting the curve in changing thermal environment
- Voltage and frequency axes are dynamically scaled now, so the captions do not overlap when window is too small
- Improved hardware control shared memory interface. During the past years, external applications like MSI Remote Server were using this interface for tuning GPU hardware settings remotely from external applications. The improvements are intended to allow connecting external stress testing and automatic overclocking related applications to MSI Afterburner via this interface:
- Now voltage/frequency curve on NVIDIA Pascal and newer NVIDIA GPU architectures is accessible via hardware control shared memory interface
- New hardware control shared memory interface command allows MSI Afterburner to load hardware settings from external application without immediately applying new settings to GPU
- Added notification message, allowing external applications to notify MSI Afterburner about new command written to hardware control shared memory. Without the notification, MSI Afterburner is executing external commands on each hardware polling iteration like before. Please refer to SDK and MACMSharedMemorySample source code to see notification message usage example
- Added hardware identification info to GPU entries in hardware control shared memory. Hardware identification info allows external applications to reconcile own enumerated devices with logical GPUs enumerated by MSI Afterburner
- Now hardware control shared memory is refreshed on delayed fan speed readback events
New bundled MSI Overclocking Scanner application in now included in MSI Afterburner distributive:
- MSI Overclocking Scanner is currently supported on NVIDIA GTX 10x0 and NVIDIA RTX 20x0 series graphics cards under 64-bit operating systems only. On such systems you may activate the scanner with dedicated button from the main application window or directly from voltage/frequency curve editor window o MSI Overclocking Scanner is powered by NVIDIA Scanner technology, which is using proprietary algorithms to quickly and reliably test manually overclocked GPU stability or find the maximum stable GPU overclocking in automatic mode with a single click. The scanner is using embedded NVIDIA test load to stress GPU. The scanner provides you two functional modes:
- In test mode MSI Overclocking Scanner is stress-testing your manual GPU overclocking settings during approximately 5 minutes. The result is returned as GPU stability confidence level (0% - unstable, 100% - stable)
- In scan mode MSI Overclocking Scanner is stress-testing and slowly increasing clocks on voltage/frequency curve points and this way automatically detecting the maximum stable GPU overclocking. The result is returned as modified voltage/frequency curve and average GPU overclocking in MHz
MSI Afterburner 4.6.0 相關參考資料
MSI Afterburner 4.6.0 Beta 16 (14806) Download - Guru3D.com
MSI Afterburner 4.5.0 official & 4.6.0 Beta download - Guru3D and MSI have been working hard on AfterBurner, today we release an updated ...
https://www.guru3d.com
MSI Afterburner 4.6.0 Download - TechSpot
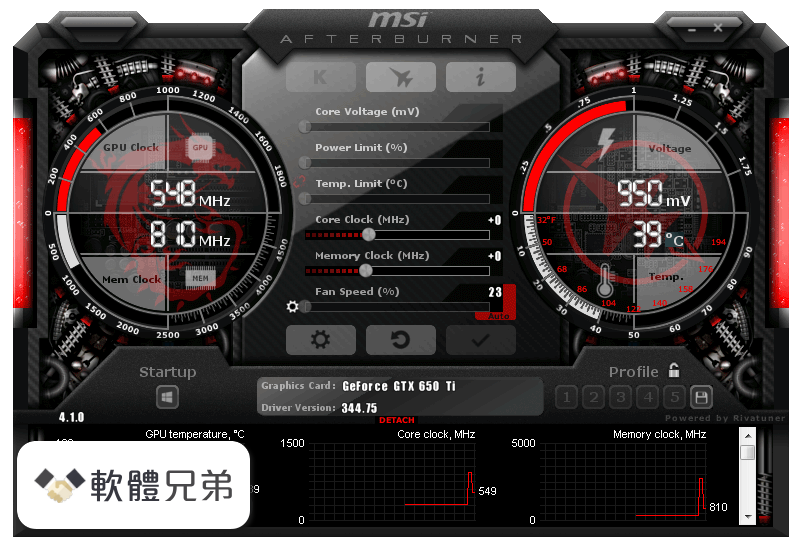
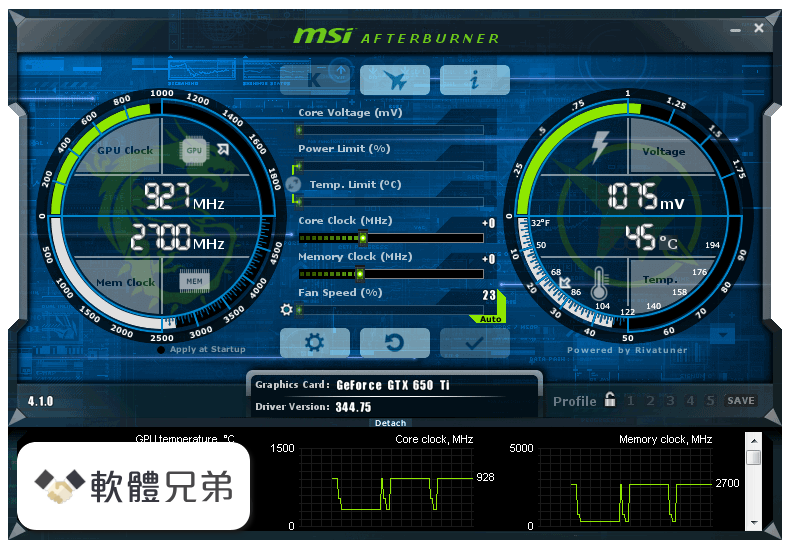
MSI Afterburner is a handy overclocking utility for MSI graphics cards. Main features include GPU/Shader/Memory clock adjustment, advanced fan speed and ...
https://www.techspot.com
顯示卡- MSI Afterburner 4.6.0 beta 10, Pascal 也支援OC Scanner ...
NVIDIA RTX 20 系列除了硬體強大之外,在軟體上也引入了OC Scanner 的功能,也就是透過各家的顯卡軟體就能輕鬆將你的RTX 20 系列進行超頻 ...
https://www.coolaler.com
|